Showing posts with label Planck. Show all posts

Tuesday, December 23, 2014

Planck's starry sky

Well December 22nd has come and gone, and the promised release of Planck data has, perhaps unsurprisingly, not materialised. Some of the talks presented at the Ferrara conference are available here, and there was a second conference in Paris more recently, video recordings from which can be found here.

I've seen a bit of speculation about the delays and what the data might or might not be showing on a few physics blogs, some of which I think are a little mistaken. So I thought I'd put up a quick post summarising the situation as I see it — but note that my opinion is not at all official and may be wrong on some of the details (especially since I wasn't at either of the conferences).

For a start, you may notice that some of the talks at Ferrara are not made available on the website. I'm informed that this internal censorship was applied by the Planck science team, and it is based on their estimation that the censored talks are ones containing results which are still preliminary and liable to change before the eventual data release. The flip side of this is that the talks that are available contain data which they are confident will not change, so these are the ones you'd want to pay attention to in any case.

In terms of the data itself, there appear to be two and a half important improvements so far. The first is that the overall calibration of the temperature power spectrum — which was previously somewhat discrepant with the WMAP measurement — has been improved, and now Planck and WMAP agree very well with each other. The second is that the apparent anomaly in the temperature power spectrum at multipole values of $\ell\sim1800$ has been identified as being due to a glitch in the 217 GHz data, and has been corrected. The anomaly has therefore disappeared. This can be seen by comparing the 2013 and 2014 versions of the TT power (if you look carefully):


The remaining half an improvement comes from the polarization data. Previously, this was so badly affected by systematics at large scales that the Planck team were only able to even show the data points at $\ell>100$, and were unable to use them for any science analysis, relying instead on the WMAP polarization. These systematics have still not been completely resolved — apparently it is the HFI instrument which is the problematic one — but they have been somewhat improved, such that the EE and TE power spectra are trustworthy at $\ell>30$, which is enough to start using them for parameter constraints in place of the WMAP data. (This means that the error bars on various derived parameter values have decreased a little from 2013, but they will decrease a lot more when all the data is finally available.)

This last half improvement is somewhat relevant to the BICEP2 issue which I discussed here, since the improved polarization data in 2014 was an important reason that Planck was able to say something about the dust polarization in the BICEP2 window. The fact that they still aren't 100% happy with this data yet could be a bit concerning. On the other hand, the relevant range of multipoles for BICEP2 is $\ell\sim80$ rather than $\ell<30$.

In terms of what these new data tell us, I'm afraid the story appears mostly rather boring, since there is very little change from what we learned already in 2013. As expected, the values of all cosmological parameters are consistent with what Planck announced in 2013; insofar as there have been any minor changes in the values, they tend to move in the direction of making Planck and WMAP more consistent with each other, but really these shifts appear very small and not worth worrying about. It appears the only parameter which has shifted at all significantly is the optical depth $\tau$. Constraints on $\tau$ rely on the use of polarization data; the previous constraints were obtained by combining Planck temperature with WMAP polarization measurements whereas the current value comes from Planck alone.

At some point I suppose the various systematics with the HFI polarization data will be sorted out to the extent that we will get the long-awaited release and the papers. But I have given up trying to predict when. In the meantime, I thought the coolest thing to come out of the recent conferences was this image:


which rather reminded me of this:

Detail from The Starry Night.
and this:

Detail from Haystacks Near a Farm in Provence. 

Monday, December 1, 2014

Planck at Ferrara

There is a conference starting today in Ferrara on the final results from Planck.

Though actually these won't be the final results from Planck, since although all scientists in the Planck team have been scrambling like mad to prepare for this date, they haven't been able to get all their results ready for presentation yet. So the actual release of most of the data and the scientific papers is scheduled for later this month. December 22nd, in fact — for European scientists, almost the last working day of the year (Americans tend to have some conferences between Christmas and New Year) — so at least we will technically have the results in 2014.

Except even that isn't really it, because the actual Planck likelihood code will only be released in January 2015. Or at least, I'm pretty sure that's what the Planck website used to say: now it doesn't mention the likelihood code by name, referring instead to "a few of the derived products."

If you're confused, well, so am I. The likelihood code is one of the most important Planck products for anyone planning to actually use Planck data for their own research — to do so properly normally means re-running fits to the data for your favourite model, which means you need the likelihood code. (Of course, some people do take the short cut of simply quoting Planck constraints on parameters derived in other contexts, and this is not always wrong.) This means that having the final, correct version likelihood code is rather important even for Planck scientists themselves to be completely confident in the results they are presenting. So it would make more sense to me if the likelihood code were released at the same time as the rest of the data. Perhaps that is what is actually going to happen, I suppose we'll find out soon.

Incidentally, my information is that the "final, correct" version of the likelihood code was distributed for internal use within the Planck collaboration about 4 weeks ago or so. Considering that it is only after this happens that proper model comparison projects can begin, that obtaining parameter constraints for each model can take a surprisingly large amount of computing time, that the various Planck teams responsible for this step had scores of different models to investigate, that the "final, correct" version may well have undergone a subsequent revision, and that the process of drafting each paper at the end of the analysis must itself take a couple of weeks minimum ... I suppose I'm not very surprised that the date for data release has been pushed back.

There's some uncertainty about whether the videos from the conference will be made available, as a statement on the website saying this would happen has been removed. For those interested here is a Youtube channel purporting to provide video from the conference, but disappointingly it doesn't appear to actually work. 

Monday, September 22, 2014

Biting the dust

Sorry about the obvious pun in the title. Today's important announcement is of course the long-awaited Planck verdict on the level at which the BICEP2 "discovery" of primordial gravitational waves had been contaminated by foreground dust. That verdict does not look good for BICEP.

(Incidentally, back in July I reported a Planck source as saying this paper would be ready in "two or three weeks". Clearly that was far too optimistic. But interestingly many members of the Planck team themselves were confidently expecting today's paper to appear about 10 days ago, and the rumour is that the current version has been "toned down" a little, perhaps accounting for some of the additional delay. Despite that it's still pretty devastating.)

Let me attempt to summarize the new results. Some important points are made right in the abstract, where we read:
"... even in the faintest dust-emitting regions there are no "clean" windows in the sky where primordial CMB B-mode polarization measurements could be made without subtraction of foreground emission"
and that
"This level [of the dust power in the BICEP2 window, over the multipole range of the primordial recombination bump] is the same magnitude as reported by BICEP2 ..."
(my emphasis). Although
"the present uncertainties are large and will be reduced through an ongoing, joint analysis of the Planck and BICEP2 data sets,"
from where I am looking unfortunately it now does not look as if there is a realistic chance that what BICEP2 reported was anything more than a very precise measurement of dust.

The Planck paper is pretty thorough, and actually quite interesting in its own right. They make use of the fact that Planck observes the sky at many frequencies to study the properties of dust-induced polarization. Whereas BICEP2 was limited to a single frequency channel at 150 GHz, the Planck HFI instrument has 4 different frequencies, of which the most useful is at 353 GHz. Previous Planck results have already shown that dust emission behaves sort of like a (modified) blackbody spectrum at a temperature of 19.6 Kelvin. Since this is a significantly higher temperature than the CMB temperature of 2.73 K, dust emission dominates at higher frequencies, which means that the 353 GHz channel essentially sees only dust and nothing else. Which makes it perfect for the task at hand, since in this particular situation roles are reversed and it is the dust that is the signal and the primordial CMB is noise!

The analysis proceeds in a number of steps. First, they study the power spectra of the two polarization modes (EE and BB) in several different large regions in the sky:

The different large sky regions studied are shown as increments of red, orange, yellow, green and two different shades of blue. The darkest blue region is always excluded. Figure from arXiv:1409.5738.
In all these different regions, both power spectra $C_\ell^{EE}$ and $C_\ell^{BB}$ are proportional to $\ell^{\alpha}$, consistent with a value of $\alpha=-2.42\pm0.02$. Fixing $\alpha$ to this value, the amplitude of the power spectra in the different large regions then shows a characteristic dependence on the mean intensity of the dust emission — i.e. regions with more dust overall also show more polarization power — and this purely empirical relationship is characterized by
$$A^{EE,BB}\propto\langle I_{353}\rangle^{1.9},$$though with a bit of uncertainty in the fit. The amplitudes of the polarization power spectra then also show a dependence on frequency from 353 GHz down to 100 GHz which matches previous Planck results (the dependence is something close to a blackbody spectrum at 19.6 K, but with a specific modification).

It then turns out that if the sky is split into very many much smaller regions close to the poles rather than the 6 large ones above, the same results continue to hold on average, though obviously there is some scatter introduced by the fact that dust in different bits of the sky behaves differently. So this allows the Planck team to take the measured dust intensity in any one of these smaller regions and extrapolate down to see what the contribution to the BB power would be if measured at the BICEP2 frequency of 150 GHz. The result looks like this:

The level of dust contamination across the in measurements of the primordial B-mode signal. Blue is good, red is bad. The BICEP2 window is the black outline on the right.
This really sucks for BICEP2, who chose their particular patch of the sky precisely because, according to estimates of the 1990s and early 2000s, it was supposed to have very little dust. Planck is now saying that isn't true, and that there is a better region just a little further south. Even that better region isn't perfect, of course, but it may be clean enough to see a primordial GW signal of $r\sim 0.1$ to $0.2$ — if such a signal exists, and if we're lucky and/or figure out cleverer ways of subtracting the dust foreground.

The problem with the BICEP2 region is that Planck's estimate of the dust contribution there looks like this:

Planck's estimate of the dust contribution to the BB power spectrum at 150 GHz and in the BICEP2 sky window. The first bin is the one that's most relevant. The black line is the contribution primordial GW with $r=0.2$ would make, if they existed.
So it appears that in the BICEP2 window, in the $\ell$ region where primordial gravitational waves produce a measurable BB signal (and BICEP2 has measured something), dust is expected to produce the same amplitude of signal as does an $r=0.2$. In fact, even accounting for the uncertainties in the Planck analysis (the extent of the pink error bars on the plot) it is clear that (a) dust will be contributing significantly to the BICEP2 measurement, and (b) it's pretty likely that only dust is contributing.

Planck avoid explicitly saying that BICEP2 haven't seen anything but dust. This is because they haven't directly measured the dust contribution in that window and at 150 GHz. Rather what's shown in the plot above is based on a number of little steps in the chain of inference:
  1. generally, the BB polarization amplitude is dependent on the average total dust intensity in a region;
  2. the relationship between these two doesn't vary too much across the sky;
  3. generally, the frequency dependence of the amplitude shows a certain behaviour;
  4. and again this doesn't appear to vary too much across the sky
  5. Planck have measured the average dust intensity in the BICEP2 window, and this gives the value shown in the plot above when extrapolated to 150 GHz;
  6. and the BICEP2 window doesn't appear to be a special outlier region on the sky that would wildly deviate from these average relationships;
  7. so, the dust amplitude calculated is probably correct.
Update: See the correction in the comments — the Planck paper actually does better than this. That is to say, they present one analysis that relies on all steps 1-7, but in addition they also measure the BB amplitude directly at 353 GHz and extrapolate that down to 150 GHz relying only on steps 3 and 4. The headline result is the one based on the second method, which actually gets a lower number for the dust amplitude. 

So they leave open the small possibility that despite having been unlucky in the original choice of the BICEP2 window, we've somehow ultimately got very lucky indeed and nevertheless measured a true primordial gravitational wave signal. 

Time will tell if this is true ... but the sensible betting has now got to be that it is not.

Incidentally, I have just learned that in two days' time I will be presenting a 30 minute lecture to a group of graduate students about this result. The lecture is not supposed to be very detailed, but I'm also not very much of an expert on this. So if you spot any errors or omissions above, please do let me know through the comments box!

Monday, July 14, 2014

Short news items

Over the past two months I have been on a two-week seminar tour of the UK, taken a short holiday, attended a conference in Estonia and spent a week visiting collaborators in Spain. Posting on the blog has unfortunately suffered as a result: my apologies. Here are some items of interest that have appeared in the meantime:
  • The BICEP and Planck teams are to share their data — here's the BBC report of this news. The information I have from Planck sources is that Planck will put out a paper with new data very soon (about a week ago I heard it would be "maybe in two weeks", so let's say two or three weeks from today). This new data will then be shared with the BICEP team, and the two teams will work together to analyse its implications for the BICEP result. From the timescales involved my guess is that what Planck will be making available is a measurement of the polarised dust foreground in the BICEP sky region, and the joint publication will involve cross-correlating this map with the B-mode map measured by BICEP. A significant cross-correlation would indicate that most (or all) of the signal BICEP detected was due to dust.
  • What Planck will not be releasing in the next couple of weeks is their own measurement of the polarization of the CMB, in particular their own estimate of the value of $r$. The timetable for this release is still October: this is a deadline imposed by the fact that ESA requires Planck to release the data by December, but another major ESA mission (I forget which) is due to be launched in November and ESA don't like scheduling "competing" press conferences in the same month because there's only so much science news Joe Public can absorb at a time. From what I've heard, getting the full polarization data ready for October is a bit of a rush as it is, so it's fairly certain that's not what they're releasing soon.
  • By the way, I think I've recently understood a little better how a collaboration as enormous as Planck manage to remain so disciplined and avoid leaking rumours: it's because most of the people in the collaboration don't know the full details of the results either! That is to say, the collaboration is split into small sub-groups with specified responsibilities, and these sub-groups don't share results with each other. So if you ask a randomly chosen Planck member what the preliminary polarization results are looking like, chances are they don't know any better than you. (Though this may not stop them from saying "Well, I've seen some very interesting plots ..." and smiling enigmatically!)
  • The conference I attended in Estonia was the IAU symposium in honour of the 100th birth anniversary of the great Ya. B. Zel'dovich, on the general topic of large-scale structure and the cosmic web. I'll try to write a little about my general impressions of the conference next time. In the meantime all the talks are available for download from the website here.
  • A science news story you may have seen recently is "Biggest void in universe may explain cosmic cold spot": this is a claim that a recently detected region with a relative deficit of galaxies (the "supervoid") explains the existence of the unusual Cold Spot that has been seen in the CMB, without the need to invoke any unusual new physics. The claim of the explanation is based on this paper. Unfortunately this claim is wrong, and the paper itself has several problems. My collaborators and I are in the process of writing a paper of our own discussing why, and when we are done I will try to explain the issues on here as well. In the meantime, you heard it here first: a supervoid does not explain the Cold Spot!
Update: It has been pointed out to me that last week Julien Lesgourgues gave a talk about Planck and particle physics at the Strong and Electroweak Matter (SEWM14) symposium, in which he also discussed the timeline of forthcoming Planck and BICEP papers. You can see this on page 12 of his talk (pdf) and it is roughly the same as what I wrote above (except that there's a typo in the year — it should be 2014 not 2015!).

Monday, March 17, 2014

First Direct Evidence for Cosmic Inflation

That was the title of the BICEP2 presentation today. Gives you some idea about the magnitude of the result, if it holds up: it really is astonishingly exciting.

Unfortunately it was so exciting that we in Helsinki couldn't even access the Harvard server and so couldn't watch any of the webcast at all. It seems the same was true for most other cosmologists around the world. So my comments here are based purely on a preliminary reading of the paper itself, and a distillation of the conversations occurring via Facebook and the like.

Firstly, the headline results: the BICEP team claim to have detected a B-mode signal in the CMB at exceedingly high statistical significance. Their headline claim is

$r=0.2^{+0.07}_{-0.05}$, with $r=0$ disfavoured at $7.0\sigma$

That is frankly astonishing. Here's the likelihood plot:

BICEP2 constraint on the tensor-to-scalar ratio r. 

(All figures are taken from the paper avalaible here.)

The actual measurement of the BB power spectrum looks like this:


The black points are the new measurements, the other coloured points are the previously available best upper limits. The solid red curve is the theoretical expectation from lensing (the relatively boring contribution to BB), the dashed red curve that dies off is the theoretical expectation from a model with inflationary gravitational waves and $r=0.2$, and the other dashed red curve (were they short of colours?!) is the total.

They've also done a pretty good job of eliminating other foreground sources (dust, synchrotron emission etc.) as possible explanations for the signal seen, which means it is much more likely that the signal is actually due to primordial gravitational waves from inflation. In doing this, it helps that the signal they see is actually as large as it is, since there's less chance of confusing it with these foregrounds (which are much smaller).  [Update: I'm not an expert here, apparently some others were less convinced about the removal of foregrounds. Not sure why though – I'd have thought other systematic errors were far more likely to be a problem than foregrounds.]

So far so good. In fact — and I really can't stress this enough — this is an extraordinary, wonderful, unexpected result and huge congratulations to the BICEP team for achieving it. It will mean a lot of happy theorists as well, because we finally have something new to try to explain!

However, it is very important that as a community we remain skeptical, particularly so when - as here - the result is one that we would so desperately love to be true. Given that, I'm going to list a serious of things that are potentially worrying/things to think about/things I don't understand. (Some of these are not things I noticed myself, but were points raised by Dave Spergel, Scott Dodelson and other experts at the ongoing live discussion on Facebook.) Doubtless these are questions the BICEP team will have thought about themselves; perhaps they already have all the answers and will tell us about them in due course — as I said, no one I know was able to watch the webcast live.

  • In the BB-spectrum plot above, the data seem to be showing a significant excess above expectations for multipoles about $\ell\sim200-350$. What's going on with that?
  • This is particularly noticeable in another figure (Fig. 9) in the paper:
  • From the above figure, preliminary results of the cross-correlation with Keck don't show the excess at high-$\ell$ (a reason to believe it might go away), but the same cros-correlation also shows less power at lower $\ell$ (which is a bit confusing).
  • At lower values of $\ell$ the EE power spectrum also shows an excess (Fig. 7):
  • All the above points put together suggest that perhaps there is some leakage in the polarisation maps coming from the temperature anisotropy — a large part of the analysis work is concerned with accounting for and correcting for any such leakage, of course, the question is to what extent independent experts will be satisfied that these methods worked.
  • Although the headline figure is $r=0.2$, they rather confusingly later say that when the best possible dust model is used for foreground subtraction, this becomes $r=0.16^{+0.06}_{-0.05}$. But if this the the best possible dust model, why is this not the quoted headline number? Is this related somehow to the power excess at $\ell\sim200-350$?
  • If $r$ is as large as they have measured why was it not seen by Planck? Actually this is a fairly complicated question: the point being that if the tensor amplitude is so large, it should make a non-negligible contribution to the temperature power spectrum as well, which would have affected Planck's results. Planck had a constraint $r<0.11$, but this specifically assumed that the primordial power spectrum had a power-law form with no running (sorry about the technical jargon, unfortunately not enough time to explain here today). So BICEP suggest one way around this tension is to simply introduce a running, but it seems (but this bit was not entirely clear to me from the paper) that you need a fairly large value of the running for this explanation to fly. And if you've got a large running then you have to worry about why not a running of the running, a running of the running of the running and so on ad infinitum - in fact how do we know that the power-law expansion form of the $P(k)$ is the correct way to go at all?
  • Besides, are there viable inflationary models that predict both large $r$ as well as large running (or non-power-law form of the primordial power)? Given the vast array of inflationary models, the answer to this question is almost certainly yes, but people may consider some other explanations more worthwhile ...
Phew. There are probably lots of other things to think about, but that's about all I can manage today. It's been a very exciting day!

Tuesday, June 4, 2013

CPPP 13

This week I am attending this workshop in Helsinki. The focus of the workshop is on re-evaluating theoretical issues in cosmology in light of the new data from the Planck satellite. 

Although the data were released in March, so far as I know they have not yet inspired any major theoretical breakthroughs. This is partly because the results were somewhat disappointingly boring, in that there is no smoking-gun indication in the data of failures of our current cosmological model (for more on this, see here), and therefore no clear hints of which extensions of the model we should be looking to explore further. There are still some niggles in the data, to be sure – such as the much advertised "anomalies". But these have not yet led to any major advances either. As a community it seems we cosmologists are still digesting the Planck results.

This workshop should aid that process of digestion. There are many scientists from all over the world attending, and I'm looking forward to hearing what they think about what the data mean. The way the workshop has been organised deliberately leaves plenty of time for discussion in between the scheduled talks, which I think is always the best way to go. I'm not giving a talk myself, though some work I did recently with Shaun Hotchkiss and Samuel Flender, who are both based in Helsinki, will feature in the poster session. Samuel gets most of the credit for preparing our poster though!

I'm not going to attempt to blog about the workshop in real time. Instead I will try to make a few notes and provide a single post at the end of the week touching on what I thought were the most interesting topics of the week. If you want more detail on each day, you should read Shaun's introduction and day-by-day accounts at The Trenches of Discovery. He did a similar thing before for the official ESA Planck conference, which was very successful. But I'd rather him than me, especially as internet access is rather expensive at my hotel!


Meanwhile, the most remarkable fact to note about Helsinki right now is the weather: a thermometer in my hotel said it was 28ºC this morning, which is wonderful outdoors but when combined with quadruple-glazed windows makes nights rather uncomfortable ...

Monday, May 27, 2013

An inconsistent CMB?

When the Planck science team announced their results in March, they also put out a great flood of papers. You can find the list here; there are 29 of them, plus an explanatory statement.

Except if you look carefully, only 28 of the papers have actually been released. Paper XI, 'Consistency of the data', is still listed as "in preparation". Now, what this paper was supposed to cover was the question of how consistent Planck results were with previous CMB experiments, such as WMAP. We already knew that there were some inconsistencies, both in the derived cosmological parameters such as  the dark energy density and the Hubble parameter, and in the overall normalization of the power seen on large scales. We might expect this missing paper to tell us the reason for the inconsistencies, and perhaps to indicate which experiment got it wrong (if any). The problem is that at present there is no indication when we can expect this paper to arrive – when asked, members of the Planck team only say "soon". I presume that the reason for the delay is that they are having some unforeseen difficulty in the analysis.

However, if you were paying attention last week, you might have noticed a new submission to the arXiv that provided an interesting little insight into what might be going on. This paper by Anne Mette Frejsel, Martin Hansen and Hao Liu – the authors are at the Niels Bohr Institute in Copenhagen, and in fact all three recently visited Bielefeld for our Kosmologietag workshop – applied a particular consistency check to Planck and WMAP data ... and found WMAP wanting.

The test they applied is really pleasingly simple. Suppose you want to measure the CMB temperature anisotropies on the sky using your wonderful satellite – either WMAP or Planck. Unfortunately, there's a great big galaxy (our galaxy) in the way, obscuring quite a large fraction of the sky:

The CMB sky as seen by Planck in the 353 GHz channel.  Obviously there's a lot of foreground in the way. (This is not the best frequency for viewing the CMB, by the way. I chose it only because it illustrates the foregrounds quite nicely!)

Now, as I've mentioned before, there are clever ways of removing this foreground and getting to the underlying CMB signal. The CMB signal is what is interesting for cosmologists, because that is what gives us the insight into fundamental physics. Foregrounds are about messy stuff to do with the distribution of dust in our galaxy: the details are complicated, but the underlying physics is not that interesting (ok, maybe it is, but to different people). Anyway, using their clever techniques (and measurements of the CMB+foreground at several different frequencies), the guys at Planck or WMAP can come up with the best map they can that they think represents the CMB with foreground removed.

Planck's SMICA map of the CMB.

The map above shows the Planck team's effort. Well actually they produced four different such "CMB only" maps, constructed by four different methods of removing the foregrounds. These are known as the SMICA, SEVEM, NILC and Commander-Ruler maps, the names indicating the different foreground-removal algorithms used. For some reason, Commander-Ruler appears not to be recommended for general use. WMAP on the other hand produced only one, known as the Internal Linear Combination or ILC map. (Planck's NILC is meant to be a counterpart to WMAP's ILC.)

Now, although the algorithms used to produce these maps are, as I said, very clever, the resultant maps are never going to be completely foreground-free. Let's express this as the equation

map = CMB + noise 

where the "noise" term includes foregrounds as well as instrument noise, systematics and other contaminants. If you have more than one map, they see the same fundamental CMB, but the noise contribution to each is different. So you can subtract one from the other to get a new map consisting of their difference:

difference = map1 – map2 = noise1 – noise2.

Since most of the residual noise should be due to the galactic foreground, most of the features in the difference map should be around the galactic plane. If the foreground removal has been reasonably successful, these features should also be small. And for the Planck maps, that is in fact what Frejsel, Hansen and Liu find:

 NILC–SMICA, NILC–SEVEM and SMICA–SEVEM difference maps. Figure from arXiv:1305.4033.

So the various different methods used by Planck seem to give self-consistent answers.

The same is not true, however, for WMAP. Of course WMAP only use the one method of removing foreground, but they did provide different maps based on the data they had collected after 7 years of operation and after 9 years. The ILC9–ILC7 difference map looks quite different:

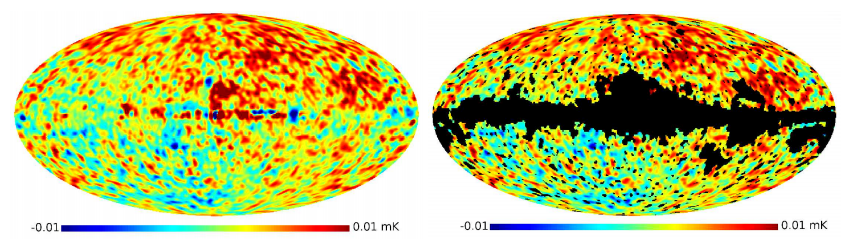
ILC9–ILC7 difference map on the left, and with a galactic mask overlaid on the right. Figure from arXiv:1305.4033.

Most of the difference appears well away from the galactic plane, as you can see in the right-hand figure, where the galaxy is masked out. So there is some important source of noise that is not foregrounds – so probably some systematics – that has affected the WMAP ILC map. Even more importantly, it is some kind of systematic effect that has changed between the 7-year and the 9-year WMAP data releases, meaning that the ILC9 and ILC7 maps do not appear to be consistent with each other. Frejsel et al. discuss a method of quantifying this, but I won't go into that here because the impression created by the images is both dramatic enough and entirely in line with the quantitative analysis.

As you might have expected, the same method shows that WMAP's ILC9 map is thoroughly inconsistent with the various Planck maps (the picture here is even worse than that between the two ILC maps). But perhaps surprisingly, ILC7 is perfectly consistent with Planck. So it appears that whatever might have affected the WMAP results only affected the final data release.

I guess one should be careful not to make too much of a fuss about this. The results from Planck and WMAP are, generally speaking, in pretty good agreement, except for some problems at the very largest scales. It is also true that the WMAP team themselves do not use the ILC map for most of their analysis (except for the low multipoles, $\ell<32$ – that is, the very largest scales!). But I'm sure this paper will provoke some head-scratching among the WMAP team as they try to figure out what has happened here. Oh, and if you are cosmologist using the ILC9 map for your own analysis, you should probably check whatever conclusions you draw using some other maps before publishing!

All in all, I think I'm rather looking forward to Planck's consistency paper when it does finally come out!